Analyze web traffic with Squid proxy & Elasticsearch/Logstash/Kibana stack
You want to know what are you sending to the Internet? This tutorial will explain how to setup Squid as a reverse proxy and how to log access queries to elasticsearch, then we will use Kibana to build a cool & clean dashboard.

We will use Docker with some official images and Docker Compose to glue all services together.
First I will discuss about softwares used, then I will show you how to install and run it.
Prepare a Docker host
You should be familiar with Docker and Docker machine:
“an open platform for distributed applications for developers and sysadmins”
“Machine lets you create Docker hosts on your computer, on cloud providers, and inside your own data center. It creates servers, installs Docker on them, then configures the Docker client to talk to them.”
https://docs.docker.com/machine/
https://registry.hub.docker.com/
We use Docker machine to create and setup a Docker host in a few seconds on VirtualBox or Amazon/Azure cloud or VMWare and Docker registry so we can install any software in a few seconds without worrying about dependencies.
Squid
Squid is a caching proxy for the Web supporting HTTP, HTTPS, FTP, and more. It reduces bandwidth and improves response times by caching and reusing frequently-requested web pages. Squid has extensive access controls and makes a great server accelerator.
Install Squid with Docker
Squid configuration
File squid.user.conf
visible_hostname proxy

http_port 0.0.0.0:3128

# ACL
http_access allow all
icp_access allow all

cache_dir ufs /var/spool/squid3 1000 16 256

access_log tcp://logstash:1025
cache_access_log /var/log/squid3/cache-access.log
cache_log /var/log/squid3/cache.log
cache_store_log /var/log/squid3/store.log

http_port 3128
The particularity is we forward access logs to a TCP server located at logstach on port 1025.
Logstash
Logstash is a data pipeline that helps you process logs and other event data from a variety of systems. With 165 plugins and counting, Logstash can connect to a variety of sources and stream data at scale to a central analytics system.
Install Logstash with Docker
Configure Logstash as TCP consumer and forward to Elasticsearch
input {
  tcp {
        port => 1025
        type => "squid-access"
   }
}

filter {
  grok {
    match => {
        "message" => "%{POSINT:timestamp}.%{WORD:timestamp_ms}\s+%{NUMBER:response_time} %{IPORHOST:src_ip} %{WORD:squid_request_status}/%{NUMBER:http_status_code} %{NUMBER:reply_size_include_header} %{WORD:http_method} %{NOTSPACE:request_url} %{NOTSPACE:user} %{WORD:squid}/%{IP:server_ip} %{NOTSPACE:content_type}"
    }
  }
}

output {
   elasticsearch {
       protocol => "http"
       host => "elasticsearch"
       port => "9200"
       index => "squid-access"
   }
}
The particularity is the Grok pattern, this will parse the squid access log entries to extract data, then the data are indexing in Elasticsearch.
Elasticsearch
Elasticsearch is an open-source search engine built on top of Apache Lucene™, a full-text search-engine library. Lucene is arguably the most advanced, high-performance, and fully featured search engine library in existence today — both open source and proprietary.
Install Elasticsearch with Docker
Configure Elasticsearch
Before sending data, we must define how Elasticsearch will interpret it, this the mapping.
{
    "settings": {
        "number_of_replicas": "1",
        "number_of_shards": "1"
    },
    "mappings": {
        "_default_": {
            "_timestamp": {
                "enabled": true,
                "path": "time",
                "format": "date_time_no_millis"
            },
            "properties": {
                "time": {
                    "type": "date",
                    "format": "date_time_no_millis"
                },
                "host": {
                    "type": "string",
                    "index": "not_analyzed"
                },
                "src_ip": {
                    "type": "string",
                    "index": "not_analyzed"
                },
                "reply_size_include_header": {
                    "type": "integer",
                    "index": "not_analyzed"
                },
                "squid_request_status": {
                    "type": "string",
                    "index": "not_analyzed"
                },
                "http_status_code": {
                    "type": "integer",
                    "index": "not_analyzed"
                },
                "http_method": {
                    "type": "string",
                    "index": "not_analyzed"
                },
                "request_url": {
                    "type": "string",
                    "index": "not_analyzed"
                },
                "content_type": {
                    "type": "string",
                    "index": "not_analyzed"
                },
                "squid": {
                    "type": "string",
                    "index": "not_analyzed"
                },
                "server_ip": {
                    "type": "string",
                    "index": "not_analyzed"
                }
            }
        }
    }
}
Kibana
Kibana is an open source analytics and visualization platform designed to work with Elasticsearch. You use Kibana to search, view, and interact with data stored in Elasticsearch indices. You can easily perform advanced data analysis and visualize your data in a variety of charts, tables, and maps.
Install Kibana with Docker
Configure Kibana
Kibana is very handy, there is an awesome web UI where you play with your Elasticsearch data and build very complex dashboard.
Install & run services
Now we know Docker images we need, let’s build our docker-compose YAML file
elasticsearch:
  image: elasticsearch:1.7
  ports:
    - 9200:9200
  volumes:
    - ./data/elasticsearch:/usr/share/elasticsearch/data:rw
  working_dir: /usr/share/elasticsearch/data

kibana:
  image: kibana:4.1
  links:
    - elasticsearch
  ports:
    - 5601:5601

logstash:
  image: logstash:1.5.3
  command: logstash -f /etc/logstash/conf.d
  volumes:
    - ./logstash:/etc/logstash:ro
  links:
    - elasticsearch
  ports:
    - 1025:1025

proxy:
  image: sameersbn/squid:latest
  volumes:
    - ./proxy/squid.user.conf:/etc/squid3/squid.user.conf:ro
    - ./data/proxy/squid/cache:/var/spool/squid3:rw
  links:
    - logstash
  ports:
    - 3128:3128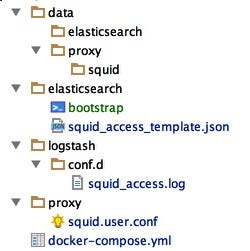
Now let’s run our small infrastructure, the big problem with docker-compose is services dependencies ;-( Here, Squid needs Logstash ready to start and Kibana needs Elasticsearch. So we are not going to use the simple
docker-compose upBut (File run.sh):
#!/bin/bashdocker-compose up -d search

sleep 5

docker-compose up -d --no-deps kibana logstash

sleep 5

docker-compose up -d --no-deps proxy

docker-compose logs
We should be able to access to Elasticsearch in order to setup the mapping:
curl -XPUT http://{IP_DOCKER_HOST}:9200/squid-access -d "$(cat elasticsearch/squid_access_template.json)"Et voilà!
Use Squid proxy
curl https://www.facebook.com -x http://{IP_DOCKER_HOST}:3128 -IOr with Firefox